Why the Distinction Matters
When a food label lists total sugars, that number bundles two very different things: sugars naturally present in the ingredients and sugars added to improve flavor, texture, or shelf life. The body processes both, but the context surrounding naturally occurring sugars - fiber in an apple, protein in milk - changes how quickly blood glucose rises and how full you feel afterward.
Added sugars, by contrast, are often described by nutrition researchers as providing energy without nutrients. Eating a cup of strawberries and drinking a sweetened fruit punch may deliver a similar gram count of sugar, but they represent meaningfully different nutritional experiences. Understanding that distinction is the starting point for reading labels without confusion. For a deeper look at how fiber shapes this equation, see our guide to dietary fiber.
Where Added Sugar Shows Up in the American Diet
Sweetened beverages - sodas, energy drinks, sweetened coffees and teas, sports drinks - consistently rank as the top source of added sugars in U.S. dietary surveys. But the picture doesn't end there. Research using NHANES (National Health and Nutrition Examination Survey) data has repeatedly identified significant contributions from snacks and sweets, followed by grains like sweetened breakfast cereals and pastries.
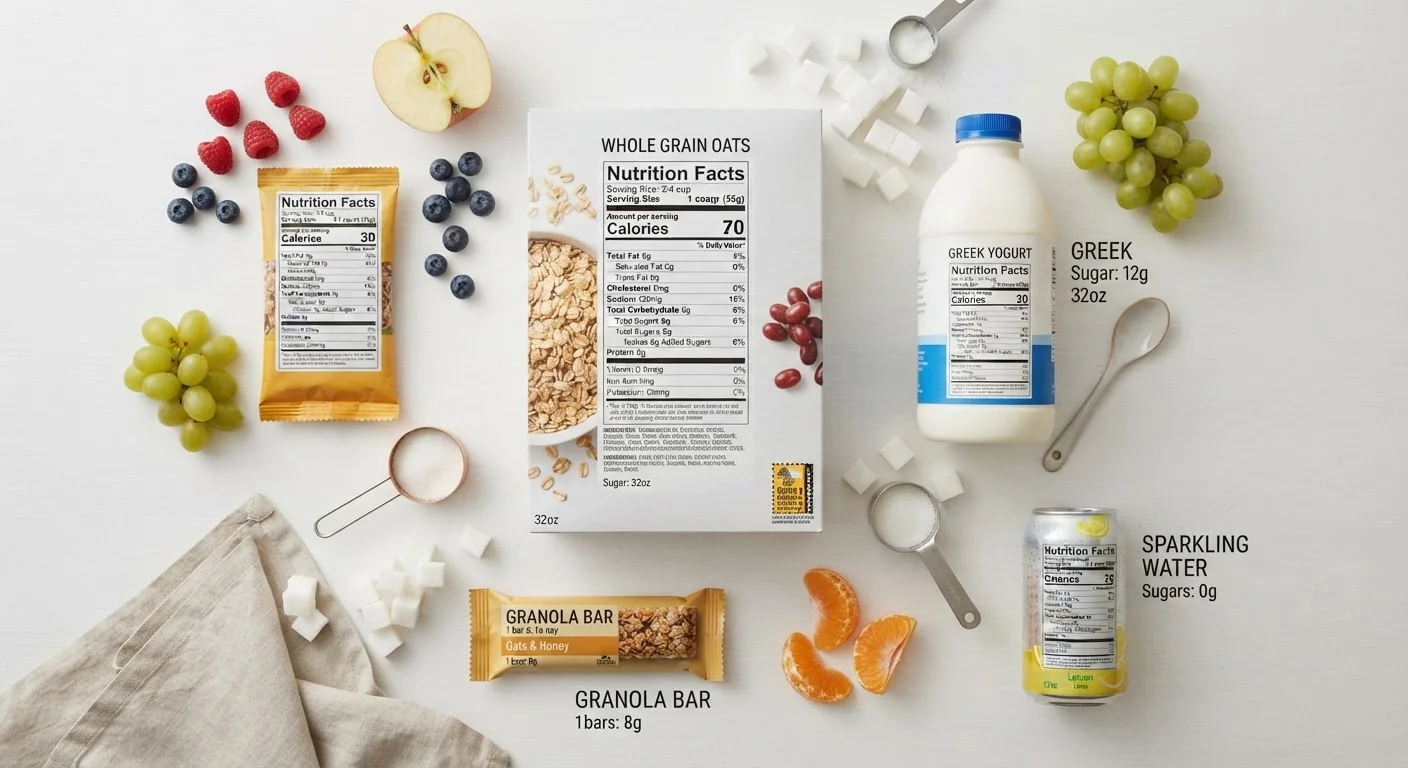
What surprises many people is the sugar load in savory or "health-adjacent" foods: flavored yogurts, granola bars, pasta sauces, salad dressings, and whole-grain breads. A single serving of some flavored yogurts can contain more added sugar than a chocolate chip cookie. That's not a reason for alarm - it's a reason to check the label rather than rely on front-of-package marketing claims.
~17 tsp
Average daily added sugar intake in the U.S.
NHANES data published by the CDC estimates average American adults consume roughly 17 teaspoons of added sugar daily - well above federal guidelines.
Nearly 50%
Share of added sugars from beverages
Sweetened beverages account for close to half of all added sugar intake among U.S. adults, according to CDC dietary data analyses.
10%
Recommended daily calorie cap from added sugars
The 2020-2025 Dietary Guidelines for Americans set this threshold; on a 2,000-calorie diet, that equals approximately 50 grams per day.
Decoding the Label
Since 2020, updated Nutrition Facts panels in the U.S. include a line that reads "Includes X g Added Sugars" directly beneath Total Sugars. That number tells you exactly how much sugar was introduced during processing, separate from anything naturally present in the ingredients. The accompanying percent Daily Value (%DV) is based on a reference of 50 grams of added sugars per day - a threshold derived from the 10% calorie recommendation in federal dietary guidelines.
Ingredient lists offer a second layer of information. Sweeteners must be listed by their specific name, and there are more than 60 terms that signify added sugar - including dextrose, maltose, evaporated cane juice, agave nectar, brown rice syrup, and fruit juice concentrate. If several of these appear, their individual amounts may each look small, but they add up. Our label-reading guide walks through the full panel in plain language.
A Quick Label Check That Takes Seconds
When comparing two similar products, go straight to the 'Includes Added Sugars' line and its %DV. A product with 5% DV or less per serving is relatively low in added sugar; 20% DV or more is considered high. This two-second check works on any packaged food without requiring mental math.
Putting the Numbers in Practical Context
The 2020-2025 Dietary Guidelines for Americans recommend keeping added sugars below 10% of total daily calories - roughly 50 grams on a 2,000-calorie reference diet. The American Heart Association applies a stricter lens, citing about 25 grams per day for women and 36 grams for men as targets linked to cardiovascular health considerations. These numbers are reference points to help calibrate intake, not rigid cutoffs that make or break a diet.
Population-level data suggests most Americans exceed these benchmarks, with a significant share of intake coming from a relatively small number of high-sugar food categories. Addressing those concentrated sources - rather than auditing every gram in every food - tends to be the most practical approach for most people. If you're curious about where other common dietary gaps appear alongside added sugar intake, our article on common diet gaps explores the broader picture.
This article is for general informational and educational purposes only and is not a substitute for professional medical or dietary advice. Consult a qualified healthcare provider or registered dietitian for guidance specific to your health situation.